
Support and Resistance: The Foundation of Technical Analysis

Why Support and Resistance Are the Foundation of Technical Analysis
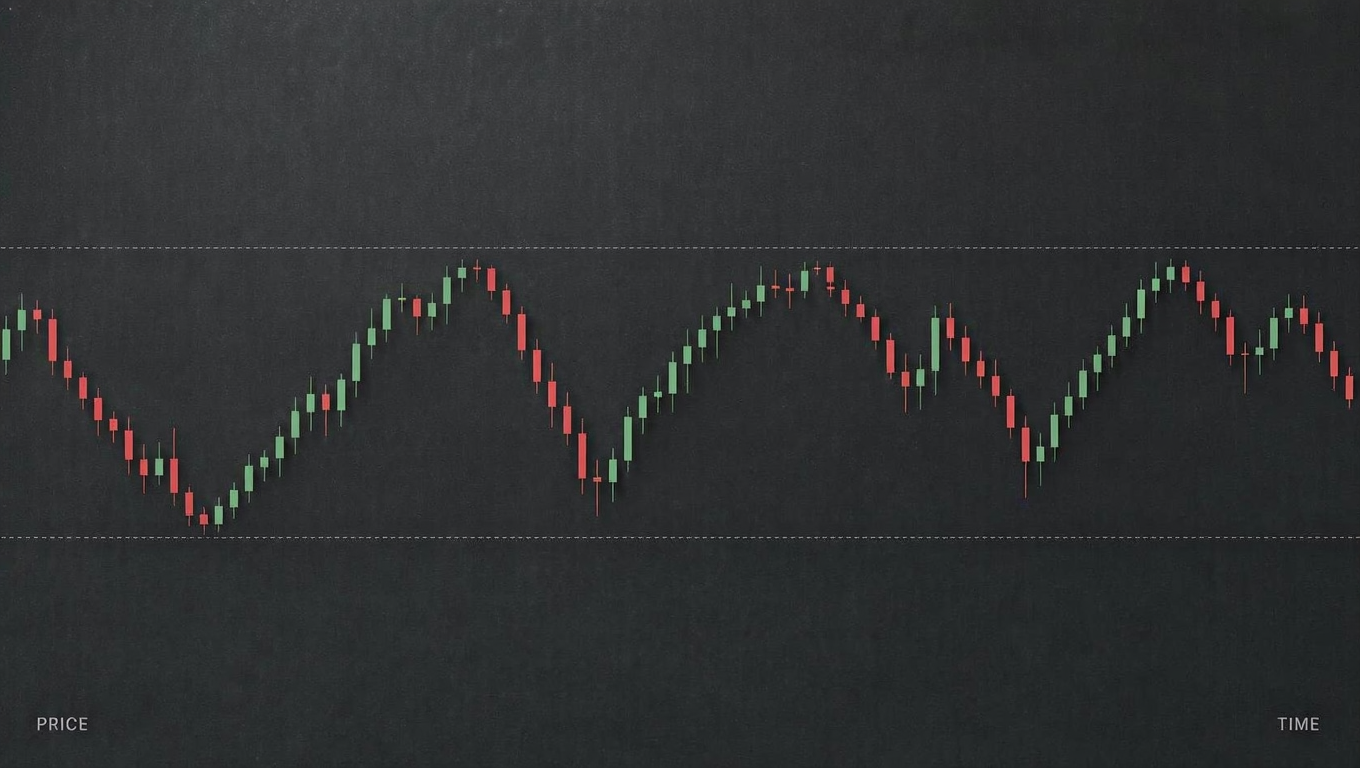
Support and resistance are the most fundamental concepts in technical analysis. Every trading strategy — whether based on indicators, price action, or patterns — ultimately relies on these key levels to make decisions. Support is a price level where buying pressure is strong enough to overcome selling pressure, causing price to stop falling and bounce higher. Resistance is the opposite — a price level where selling pressure overwhelms buying pressure, stopping price from rising further and causing it to reverse lower. These levels form because market participants remember them: traders place buy orders at levels where price has previously bounced, and sell orders at levels where price has previously reversed. Understanding how to identify, draw, and trade support and resistance is the single most important skill a technical trader can develop.
The reason support and resistance work is rooted in human psychology and market memory. When price approaches a level where it has reversed before, traders who missed the previous move place orders in anticipation of a similar reaction. Institutions and algorithmic trading systems also monitor these levels, adding to the concentration of orders at key price points. The more times a level has been tested without breaking, the stronger it becomes — each touch reinforces the level's significance in the minds of market participants. However, support and resistance are not exact lines but zones. Price may not reverse at the exact same price each time but within a range around the level. Drawing zones rather than precise lines gives you a more realistic and tradeable view of the market.
How to Identify Key Support and Resistance Levels
The most reliable support and resistance levels are formed at price points where the market has reversed multiple times in the past. Look for swing highs and swing lows on higher timeframes — daily, 4-hour, and weekly charts produce the most significant levels. The more touches a level has, the stronger it is. A resistance level that has been tested four or five times is much more significant than one tested only twice. Round numbers — such as 1.1000, 1.2000, 1.3000 on EUR/USD or 150.00, 155.00 on USD/JPY — often act as psychological support and resistance because traders naturally place orders at these easy-to-remember prices. These psychological levels are especially important in forex, where large institutional orders tend to cluster around round numbers. Previous swing highs and lows, where price has reversed direction previously, also create natural support and resistance zones. Drawing trendlines connecting higher lows (support trendline) or lower highs (resistance trendline) provides dynamic levels that move with price over time.
The Concept of Role Reversal
One of the most reliable concepts in technical analysis is role reversal — also called polarity. When a resistance level is broken decisively to the upside, that level often flips to become support on subsequent pullbacks. The logic is straightforward: traders who sold at that resistance level (and lost as price broke through) will look to exit their positions near breakeven when price returns to the level, creating buy orders. At the same time, traders who missed the initial breakout will look to enter on the pullback, adding additional buying pressure. The opposite scenario plays out when support breaks to the downside — it becomes resistance on subsequent rallies. Role reversal levels provide some of the highest-probability trade setups, especially when confirmed by a clear candlestick pattern at the retested level.
Practical Trading Strategies Using Support and Resistance
- Range trading — when price is moving sideways between clear support and resistance, buy near support with a stop below it, and sell near resistance with a stop above it. Wait for confirmation — a bullish candlestick pattern at support or a bearish pattern at resistance — before entering. This is the simplest and most reliable support/resistance strategy.
- Breakout trading — when price breaks decisively through a strong support or resistance level with momentum, enter in the direction of the breakout. A decisive break is defined by a closing price beyond the level, preferably on a higher timeframe candle. Place your stop loss inside the previous range and target the next major level.
- Pullback entry after breakout — instead of entering on the initial breakout, wait for price to return to the broken level (which has now flipped to the opposite role) and enter on the retest. This gives you a better price and tighter stop loss, at the cost of potentially missing the trade if price does not retest.
- Trendline bounces — in a clear trend, draw a trendline connecting the swing lows (uptrend) or swing highs (downtrend). Enter when price touches the trendline and shows a reversal candlestick pattern, with a stop loss just beyond the trendline.
Common Mistakes Traders Make with Support and Resistance
The most common mistake is drawing too many levels, which clutters your chart and makes every price move look significant. Focus on the most obvious, well-tested levels — typically three to five per timeframe. Use higher timeframes for stronger, more significant levels; a support level on the daily chart is far more important than one on the 5-minute chart. Another common error is treating levels as exact lines rather than zones — price may reverse somewhere near a level, not precisely at it. Give price some room (typically 5 to 15 pips depending on the timeframe) around each level. Finally, remember that all levels are potential breakpoints. No support or resistance level is guaranteed to hold — every level can and will break eventually. That is why you must always use stop losses and treat each level as a high-probability zone, not a certainty.
Multiple Timeframe Confirmation
A level that appears on multiple timeframes simultaneously carries far more weight than a level visible on only one timeframe. For example, if the daily chart shows a resistance level at 1.1050 and the 4-hour chart also has a resistance zone around the same price, that level becomes a significant decision point for the market. When you identify a potential trade setup at a support or resistance level, always check higher and lower timeframes to see if the level is confirmed. Confluence — multiple technical factors aligning at the same price — significantly increases the probability that the level will hold or break as expected.
Conclusion
Support and resistance levels are the bedrock of technical analysis. Master the art of identifying key levels by looking for multiple touches on higher timeframes, focusing on round numbers and previous swing points. Understand role reversal — when broken support becomes resistance and broken resistance becomes support — and use it to find high-probability retest entries. Combine support and resistance levels with candlestick confirmation and multiple timeframe alignment for the most reliable trading setups. Keep your charts clean by focusing on the most significant levels, treat levels as zones rather than exact lines, and always use stop losses because no level holds forever. When you master support and resistance, you build the foundation for every other technical analysis skill.
A passionate writer and content creator.
Community Comments
Please log in to comment on this blog post.
Log InNo comments yet. Be the first to comment!