
RSI Indicator: How to Trade Overbought and Oversold Levels

Understanding the RSI
The Relative Strength Index (RSI) measures the speed and magnitude of recent price changes. It oscillates between 0 and 100, helping traders identify overbought and oversold conditions, as well as momentum shifts through divergence analysis. Developed by J. Welles Wilder in 1978, the RSI has stood the test of time as one of the most reliable momentum oscillators. Its simplicity and versatility make it a favorite among traders of all experience levels. Unlike some indicators that are difficult to interpret, the RSI provides clear, actionable signals that can be integrated into virtually any trading strategy.
The RSI is calculated using a formula that compares average gains to average losses over a specified period — typically 14 periods (the default setting Wilder recommended). The result is a line that moves between 0 and 100, with readings above 70 considered overbought and readings below 30 considered oversold. However, these thresholds are not absolutes — in strong trending markets, the RSI can remain in overbought or oversold territory for extended periods. Understanding the context of the overall trend is essential for interpreting RSI signals correctly. A reading of 75 in a strong uptrend may simply confirm the trend's strength rather than signal an imminent reversal.
Reading RSI Values
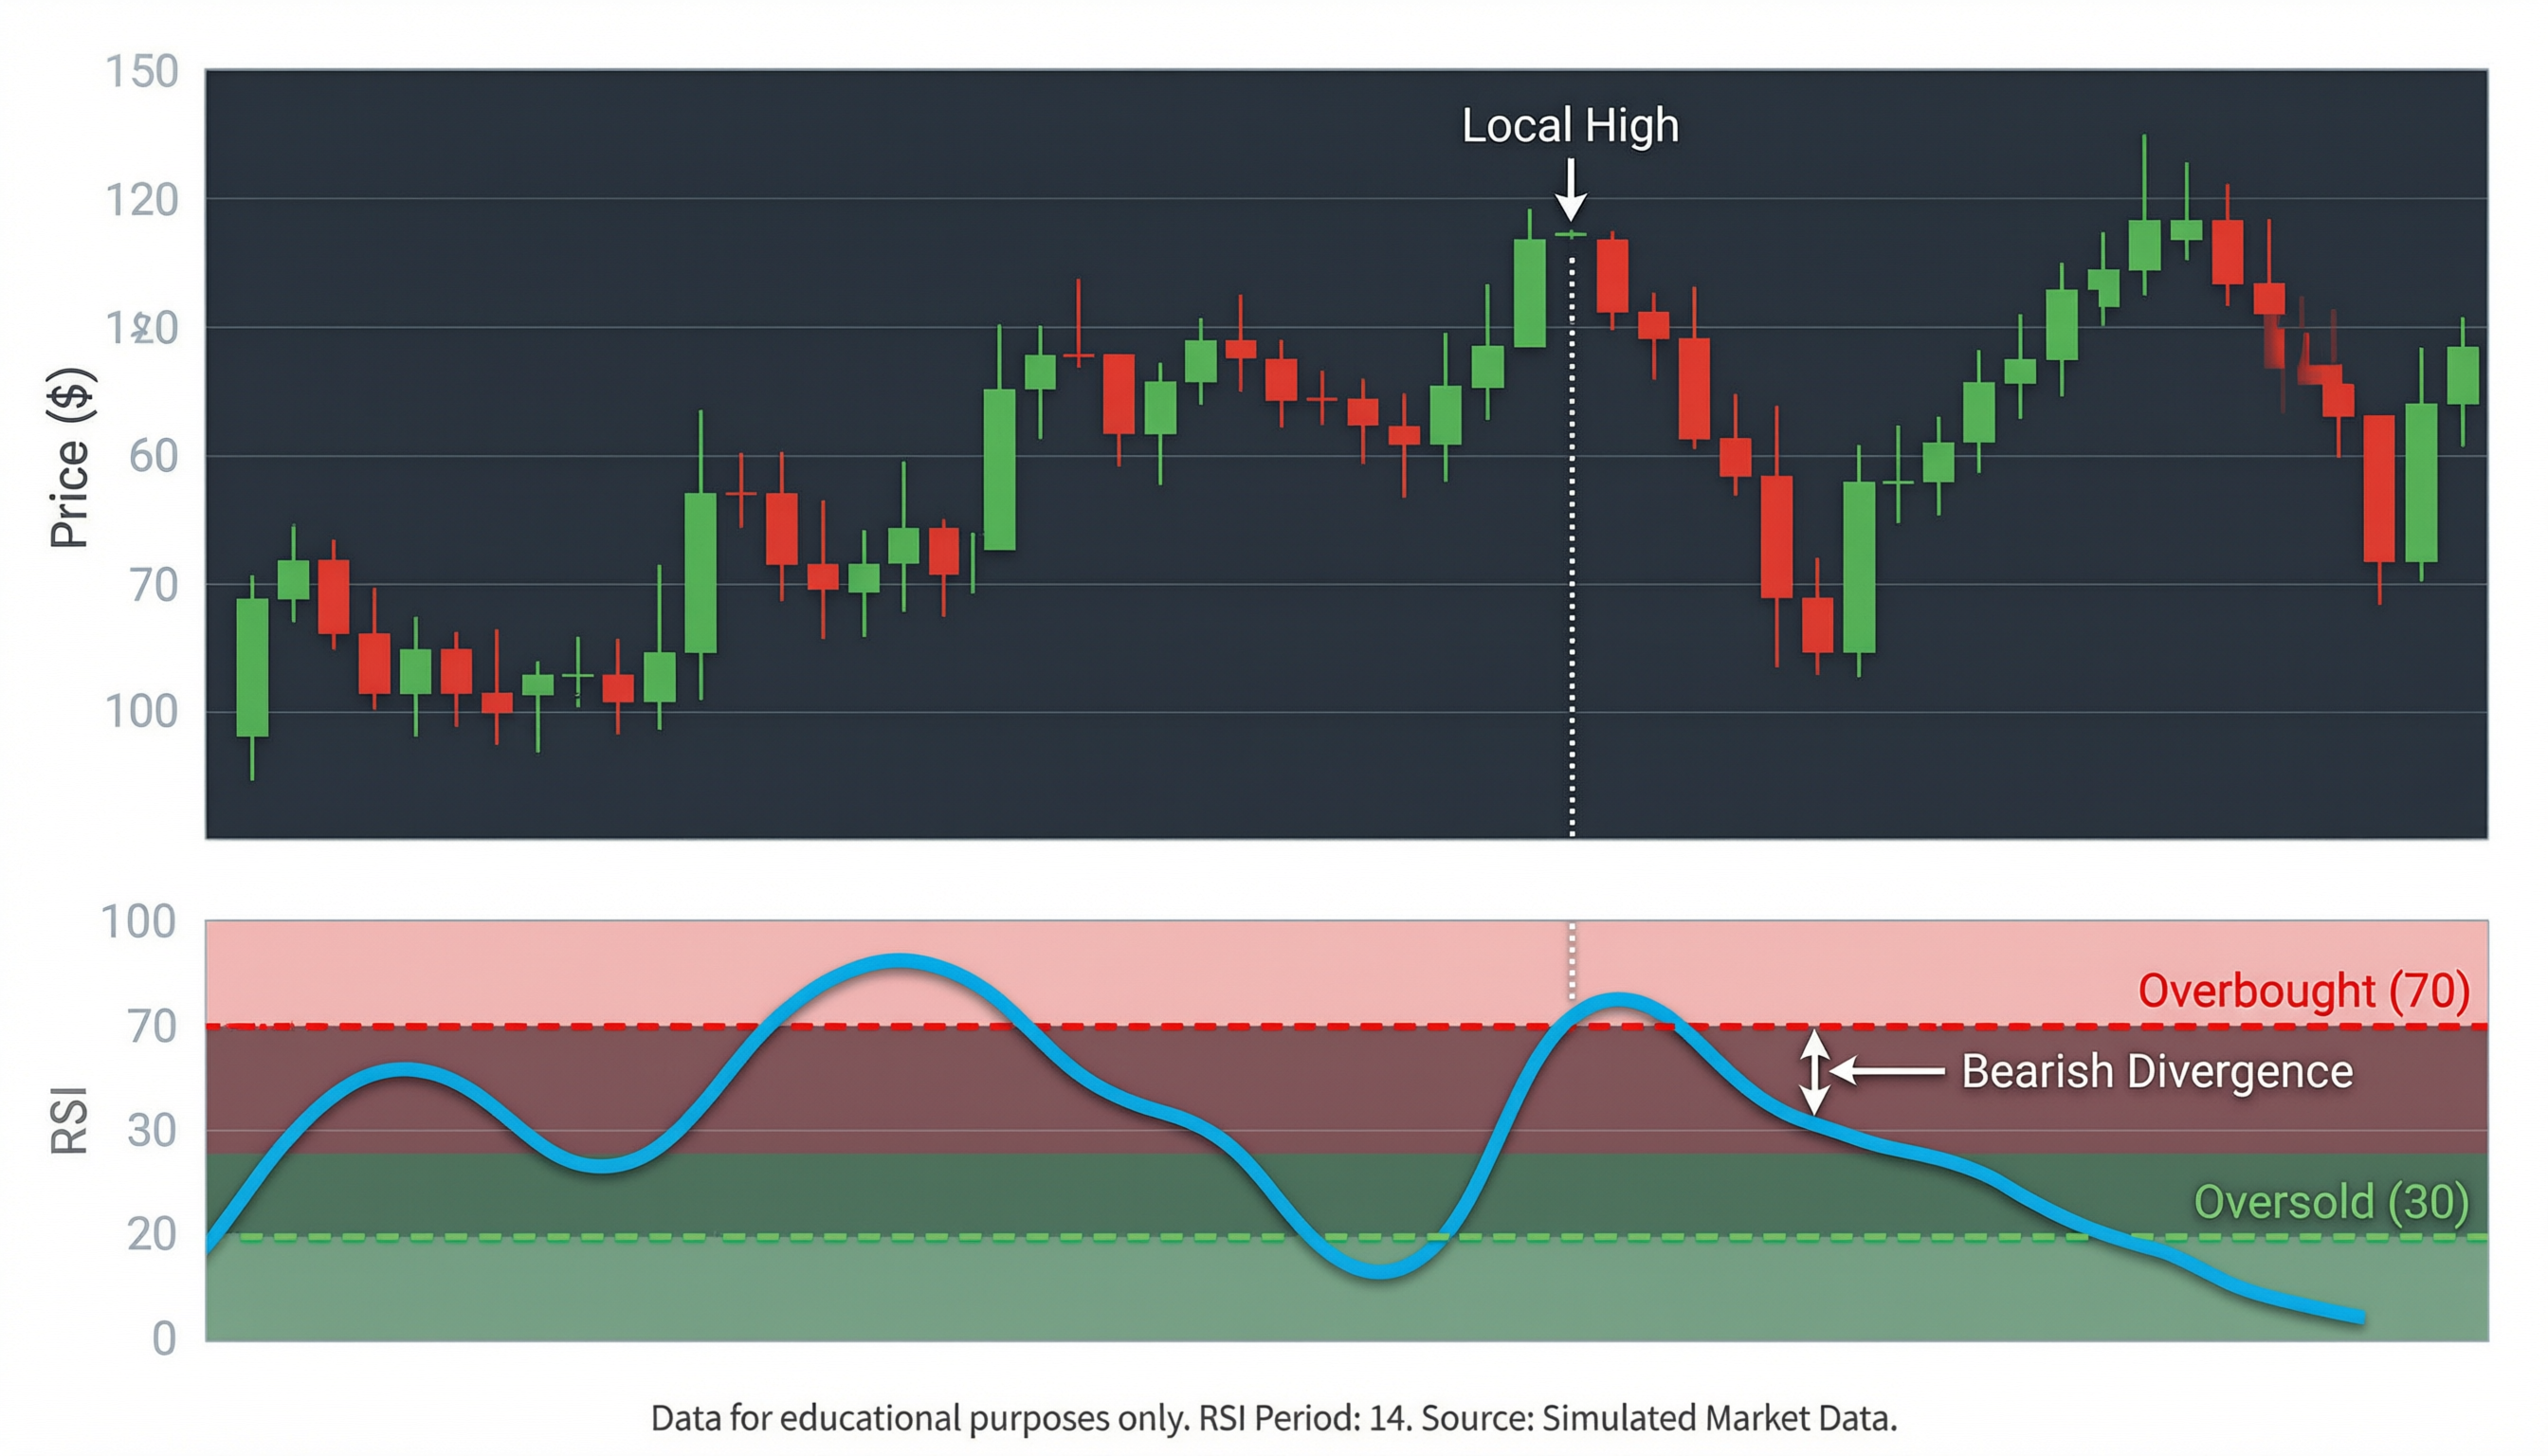
- Above 70 — overbought: price may be due for a pullback or reversal. However, in a strong uptrend, the RSI can stay above 70 for weeks. Wait for the RSI to cross back below 70 before considering a short entry, and always check the higher timeframe trend first.
- Below 30 — oversold: price may be due for a bounce or reversal. In a strong downtrend, the RSI can linger below 30. Wait for a cross back above 30 before considering a long entry. Fighting the trend based solely on oversold readings is one of the most common RSI mistakes.
- 50 level — neutral: acts as support in uptrends and resistance in downtrends. When the RSI bounces off 50 in an uptrend, it confirms the trend is healthy. When it breaks below 50 in an uptrend, it warns that momentum may be shifting. The 50 level is an important filter for confirming trend direction.
- Centerline crossovers — when RSI crosses above 50, it signals that bullish momentum is gaining strength. When it crosses below 50, bearish momentum is building. These signals are more reliable in trending markets than in ranging conditions.
RSI Divergence
Bullish divergence occurs when price makes a lower low but RSI makes a higher low — suggesting that selling momentum is weakening even as price continues to fall. This is one of the most powerful reversal signals in technical analysis. The underlying logic is that momentum always changes direction before price — the RSI is detecting that sellers are losing conviction before it becomes visible on the price chart. Bearish divergence is the opposite: price makes a higher high while RSI makes a lower high, warning that buying momentum is fading. Divergence is most reliable when it forms at extreme RSI levels (above 70 for bearish divergence, below 30 for bullish divergence) and when it aligns with key support or resistance levels on the price chart.
To trade divergence effectively, wait for confirmation. Do not enter immediately when you spot the divergence — wait for price to break the trendline connecting the recent lows (for bullish divergence) or highs (for bearish divergence), or for a confirming candlestick pattern to appear. Place your stop loss beyond the recent swing low or high, and target the next major level in the direction of the anticipated reversal. Divergence signals are not perfect — they can persist for extended periods and produce false signals in strongly trending markets. Always use divergence in conjunction with other analysis tools and proper risk management.
Common Mistakes
Do not automatically sell just because RSI is above 70 in a strong uptrend — the trend is your friend, and in strong trends, RSI can stay overbought or oversold for extended periods. Selling into a strong uptrend because RSI is \"overbought\" is a fast way to lose money. Use RSI to time entries on pullbacks within the trend rather than to pick tops and bottoms. Another common mistake is relying on RSI alone without considering market structure, support/resistance levels, or candlestick patterns. RSI works best as a confirming tool within a broader trading system. Finally, avoid changing the RSI period too frequently — stick with the default 14-period setting until you thoroughly understand how it behaves, then experiment cautiously with adjustments.
Conclusion
The RSI is a powerful and versatile indicator that every trader should learn to use. Master the basic overbought and oversold signals, understand how to identify and trade divergence, and avoid the common pitfalls of fighting the trend or relying on RSI in isolation. Use the 50 level as a trend filter, combine RSI signals with market structure and price action confirmation, and always manage your risk carefully. When used correctly, the RSI provides valuable insights into market momentum that can significantly improve your entry timing and help you avoid trading against the prevailing market force.
A passionate writer and content creator.
Community Comments
Please log in to comment on this blog post.
Log InNo comments yet. Be the first to comment!