
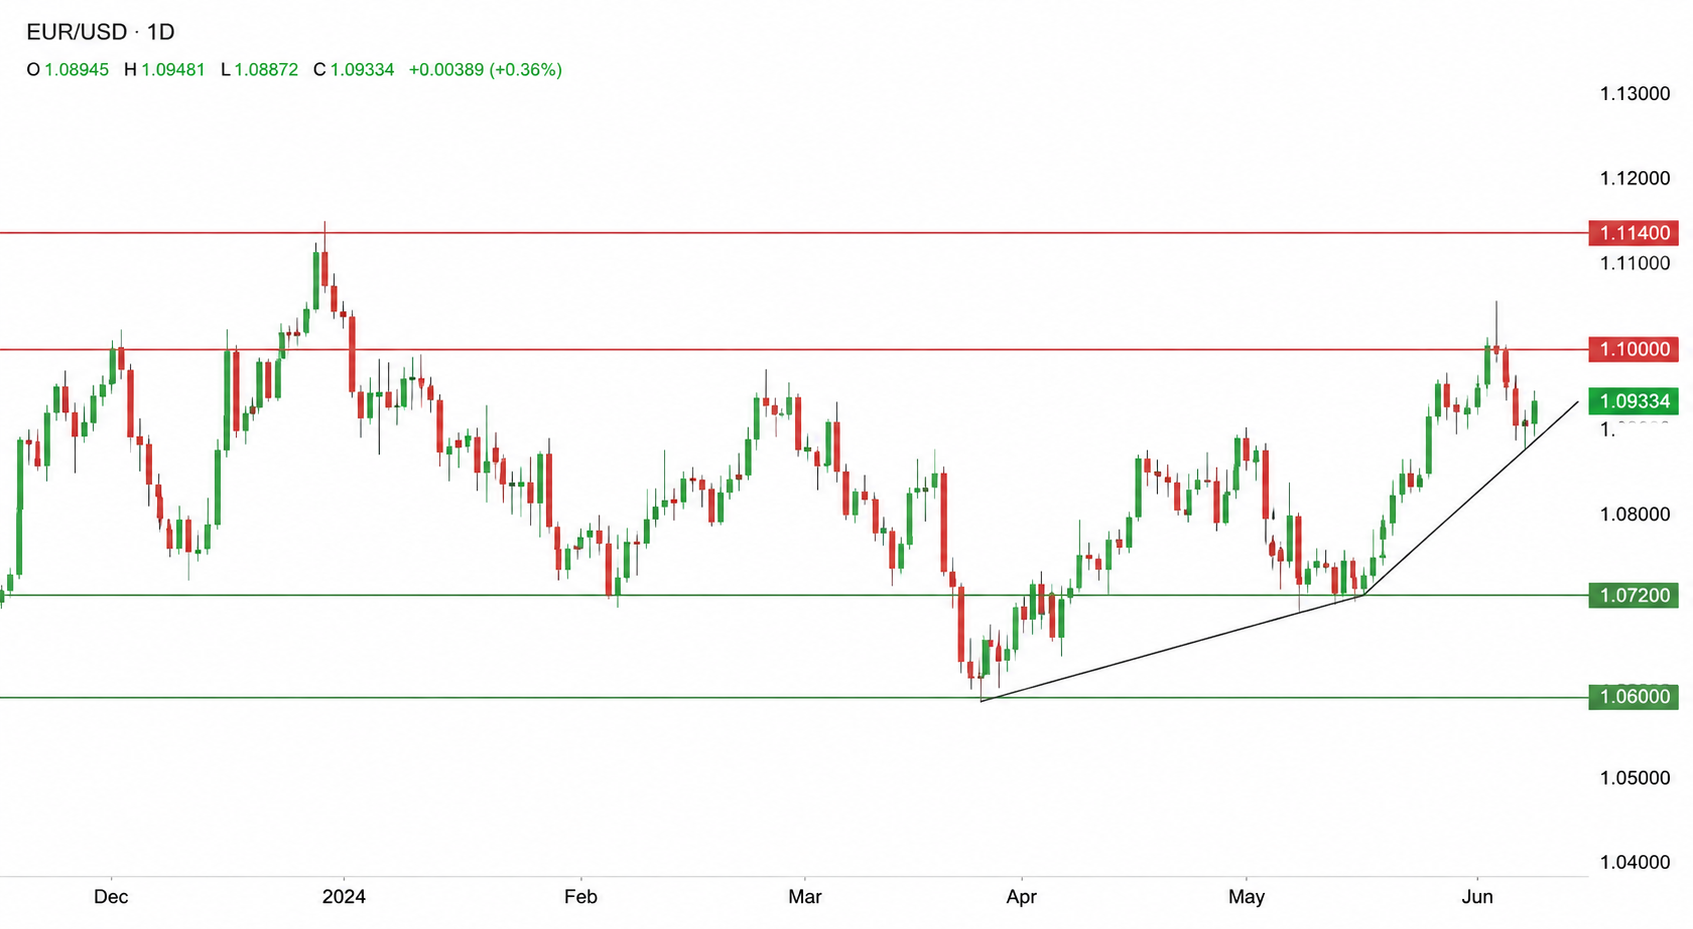
Price Action Trading: Read the Charts Without Indicators

What Is Price Action Trading?
Price action trading is the art of reading raw price movement without relying on lagging indicators. It focuses on candlestick patterns, support and resistance levels, and market structure to make trading decisions. Unlike indicator-based strategies that derive signals from mathematical calculations of past prices, price action uses the actual price data displayed on your chart — the open, high, low, and close of each candle — to interpret market psychology and predict future movement. This direct approach gives price action traders a significant advantage: they see what the market is doing in real time, not what a lagging indicator says it was doing five minutes ago.
Price action is based on a simple but powerful premise: all known information about a currency pair — economic data, geopolitical events, market sentiment, institutional order flow — is already reflected in the price. By learning to read what price is telling you, you can make trading decisions without needing to analyze individual news events or maintain complex indicator setups. This makes price action a universal approach that works across all markets (forex, stocks, commodities, crypto) and all timeframes, from 1-minute charts to weekly charts. Many of the most successful professional traders use pure price action as their primary methodology.
The Philosophy Behind Price Action
Price action trading relies on the concept that markets move in predictable patterns driven by human psychology. Fear and greed cause traders to behave in consistent ways, creating recurring chart patterns that can be identified and traded. When a long wick appears on a candle at a resistance level, it tells you that sellers stepped in and pushed price back down — the market rejected that level. When an engulfing candle forms after a downtrend, it signals that buyers overwhelmed sellers and momentum may be shifting. These patterns are not random noise; they are footprints of institutional and retail trading activity that reveal where smart money is entering and exiting positions.
Essential Candlestick Patterns
- Pin bar — long wick (shadow) signals rejection of a price level. A bullish pin bar has a long lower wick, showing price was pushed down but buyers stepped in to drive it back up. A bearish pin bar has a long upper wick, indicating sellers rejected higher prices. Trade in the direction of the rejection with a stop beyond the wick's extreme.
- Engulfing pattern — a two-candle reversal signal. A bullish engulfing pattern occurs when a small bearish candle is followed by a larger bullish candle that completely "engulfs" the previous candle's body. This shows a strong shift from selling to buying pressure. The opposite signals bearish reversal.
- Doji — a candle with a very small body, where open and close are nearly equal. Doji represents indecision in the market. After a strong trend, a doji suggests the trend may be losing momentum and a reversal could follow. Look for confirmation from subsequent price action before entering.
- Inside bar — a candle that forms entirely within the range of the previous candle. Inside bars indicate consolidation or a pause in the trend, often preceding a breakout. Trade the breakout direction when price moves beyond the mother candle's high or low.
- Morning star / Evening star — three-candle reversal patterns. A morning star (bullish) consists of a long bearish candle, a small-bodied candle (doji or spinning top), and a long bullish candle. The pattern shows selling momentum exhausted and buying taking over. The evening star is the bearish equivalent.
Market Structure Basics
Identify swing highs and swing lows to determine trend direction. An uptrend forms higher highs and higher lows — each peak is higher than the previous peak, and each trough is higher than the previous trough. A downtrend forms lower highs and lower lows — each peak is lower than the previous one, and each trough breaks below the previous trough. Trade in the direction of the overall trend for higher probability setups. When the market is ranging (no clear higher highs or lower lows), trade reversals at support and resistance levels. Market structure is the single most important concept in price action trading — it tells you who is in control (buyers or sellers) and helps you avoid trading against the dominant force.
Support and Resistance in Price Action
Support and resistance levels are price zones where the market has reversed multiple times in the past. These levels form because traders remember them — they place buy orders at previous support levels and sell orders at previous resistance levels. In price action trading, you draw horizontal lines at these key levels and wait for price to approach them. Look for reversal candlestick patterns at support to enter long trades, and reversal patterns at resistance to enter short trades. The concept of role reversal (or polarity) is crucial: when a resistance level is broken to the upside, it often becomes support on subsequent pullbacks, and vice versa. This gives you high-probability entry points when combined with candlestick confirmation.
Building a Price Action Trading Strategy
A complete price action strategy combines market structure analysis, support and resistance levels, and candlestick confirmation. Start by determining the trend on the daily chart. Then drop to the 4-hour or 1-hour chart and identify key support and resistance levels. Wait for price to approach a level that aligns with the trend direction — for example, a pullback to support in an uptrend. Look for a confirming candlestick pattern (pin bar, engulfing, or inside bar breakout) at that level. Enter on the confirmation, place your stop loss beyond the pattern's extreme, and target the next major level. This three-step process — trend, level, pattern — is the foundation of most successful price action systems.
Benefits of Price Action Trading
No lag — price action signals are based on current price movement, not smoothed historical data. Works on any timeframe, from 1-minute scalping to weekly position trading. Applicable to any market — forex, stocks, indices, commodities, and crypto all produce the same candlestick patterns and market structures. Keeps your charts clean and uncluttered — no need for multiple indicators that often contradict each other. Provides deep insight into market psychology — you learn to think like the market rather than blindly following indicator signals. Many professional traders use pure price action without a single indicator, proving that this approach can sustain a profitable long-term trading career.
Conclusion
Price action trading is a powerful, versatile approach that puts you directly in touch with what the market is doing. Master the essential candlestick patterns — pin bars, engulfing patterns, dojis, and inside bars — and learn to identify market structure and key support/resistance levels. Combine these elements into a systematic trading strategy: determine the trend, identify a key level, and wait for confirmatory price action before entering. The beauty of price action is its simplicity and universality — once you learn to read raw price movement, you have a skill that works in any market and on any timeframe. Start practicing on a demo account today, focusing on one pattern at a time until you can spot it instantly without thinking.
A passionate writer and content creator.
Community Comments
Please log in to comment on this blog post.
Log InNo comments yet. Be the first to comment!