
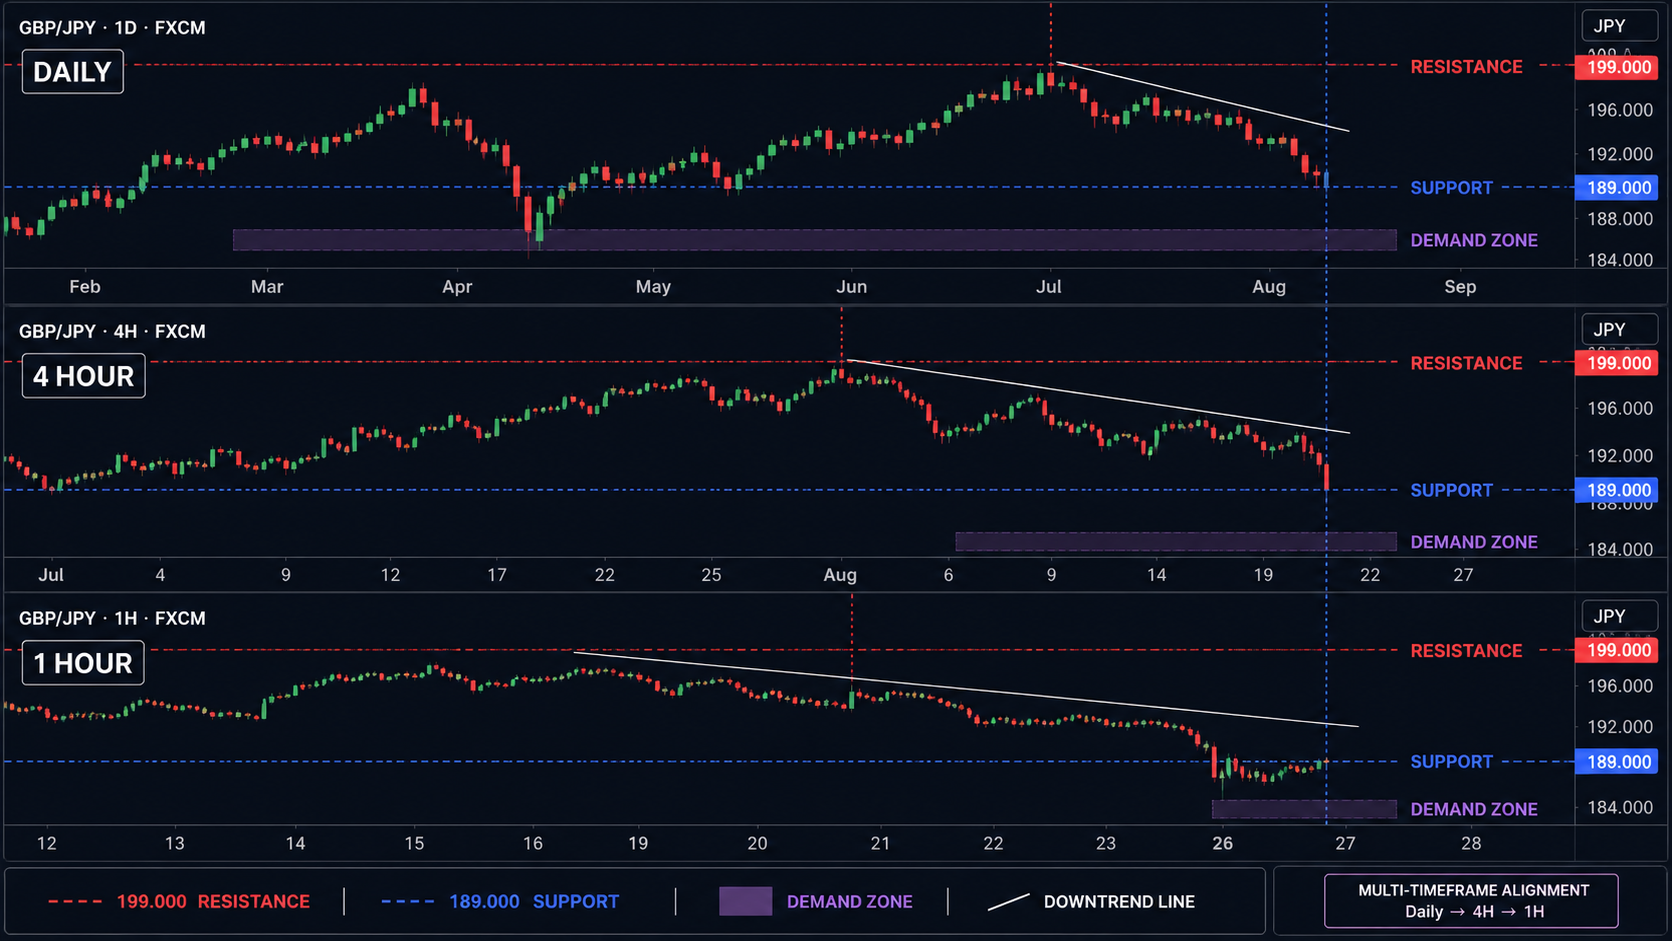
Multiple Timeframe Analysis: See the Big Picture and the Details

Why Multiple Timeframe Analysis Is Essential
Looking at a single timeframe is like looking at a tree while missing the entire forest. Multiple timeframe analysis gives you both the long-term trend — the big picture — and the precise entry timing — the detailed view — in a single coherent framework. The concept is deceptively simple: analyze the same currency pair on three different timeframes, each serving a distinct purpose. The highest timeframe (daily or weekly) tells you the dominant trend direction. The medium timeframe (4-hour or 1-hour) reveals the current price structure and potential pullback levels. The lowest timeframe (15-minute or 5-minute) allows you to pinpoint your entry with a tight stop loss and favorable risk-reward ratio. By aligning all three timeframes in the same direction, you stack the odds heavily in your favor before you place a single trade.
The practical value of this approach cannot be overstated. Many traders lose money not because their analysis is wrong, but because they are trading against the dominant trend. A trader who sees a bullish signal on the 5-minute chart and enters a long position may be unaware that the 4-hour and daily charts are in a strong downtrend. That long trade is swimming against a powerful current — it may work temporarily, but the odds are heavily against it. Multiple timeframe analysis eliminates this blind spot by forcing you to consider the broader context before every trade. It is the single most effective technique for improving your trade selection and avoiding the costly mistake of fighting the trend.
The Three-Timeframe Method Explained
- Higher timeframe (daily or weekly) — your trend compass. Determine the overall direction of the market. Is price making higher highs and higher lows (uptrend), lower highs and lower lows (downtrend), or moving sideways (range)? Identify the key support and resistance levels, major moving averages (50 SMA, 200 SMA), and significant trendlines. Your higher timeframe analysis answers one question: what direction should I be trading? The golden rule: never trade against the higher timeframe trend. If the daily chart is in a downtrend, your default bias should be short. If it is in an uptrend, bias towards long.
- Medium timeframe (4-hour or 1-hour) — your setup timeframe. This is where you identify the specific market structure and look for trading opportunities that align with the higher timeframe trend. In a daily uptrend, you watch the 4-hour chart for pullbacks to support levels, moving averages, or trendlines. The medium timeframe shows you the current price phase — is it trending strongly, pulling back, or consolidating? This is also where you note key intraday support and resistance levels that will inform your entry and stop placement.
- Lower timeframe (15-minute or 5-minute) — your execution timeframe. Once you have identified a potential setup on the medium timeframe that aligns with the higher timeframe trend, drop to the lower timeframe to fine-tune your entry. Look for specific candlestick confirmation — a bullish engulfing pattern, a pin bar, or a break of a minor trendline. The lower timeframe allows you to enter with a tighter stop loss, improving your risk-reward ratio. This precision entry is one of the greatest benefits of multiple timeframe analysis.
Practical Example: Three Timeframes in Action
Let us walk through a concrete example to show how this works. You start with the daily chart of EUR/USD and observe that price has been making higher highs and higher lows for the past four weeks — a clear uptrend. Price recently pulled back to the 20-day EMA, a dynamic support level. On the 4-hour chart, you see that the pullback has reached a previous resistance-turned-support level (role reversal) and price is forming a small consolidation range. On the 15-minute chart, you spot a clear bullish engulfing candle at the support level, followed by a second bullish candle that breaks above the consolidation range. This confluence — daily uptrend, 4-hour pullback to support, 15-minute bullish reversal pattern — gives you a high-probability long entry. You enter at the break of the engulfing candle's high, place your stop loss below the recent 15-minute swing low, and target the next major resistance level on the daily chart. Every timeframe is telling the same story — that is the power of multiple timeframe analysis.
Common Mistakes with Multiple Timeframe Analysis
The most common mistake is using too many timeframes, which leads to analysis paralysis and contradictory signals that freeze you into inaction. Three timeframes — higher, medium, lower — are sufficient for most traders. Stick to a consistent ratio of approximately 4x to 6x between timeframes: daily → 4-hour → 15-minute, or 4-hour → 1-hour → 5-minute. Another frequent error is considering conflicting signals across timeframes as a reason to trade. If the daily chart is bearish but the 4-hour chart shows a bullish setup, stay out. Conflicting timeframes mean uncertainty, and uncertainty means you should not trade. Wait until all timeframes align. A third mistake is entering on the lower timeframe signal without verifying that the medium and higher timeframe align with the trade direction. Always check from top (highest timeframe) to bottom (lowest) — never start your analysis on the 5-minute chart.
When Timeframes Conflict: What to Do
Conflicting timeframes are a signal to stay out of the market, not to trade. If the daily chart is bullish, the 4-hour chart is ranging, and the 15-minute chart shows a bearish pattern, the market has no clear directional bias at your trading horizon. Forcing a trade in this environment lowers your probability of success. Instead, wait for the timeframes to align. This may mean waiting hours or even days for the right conditions. Patience is a defining characteristic of successful traders, and multiple timeframe analysis provides an objective framework for exercising that patience. When the daily trend is clear but the medium timeframe is not providing clean setups, simply wait. The market will eventually offer you a high-probability opportunity — and multiple timeframe analysis will help you recognize it when it arrives.
Building Your Multiple Timeframe Routine
Create a systematic routine that you follow before every trade. Start your session by analyzing the daily chart — identify the trend, key support and resistance levels, and any significant candlestick patterns or technical formations. Then move to the 4-hour chart to identify the current phase of the market and look for potential setups that align with your daily bias. Finally, use the 15-minute or 5-minute chart to confirm the setup with precise candlestick patterns and execute your trade. Document your analysis for each timeframe in your trading journal. Over time, this routine becomes second nature, and you will find yourself instinctively checking higher timeframes before every decision. The few extra minutes this adds to your pre-trade analysis will save you from countless losing trades taken against the dominant trend.
Conclusion
Multiple timeframe analysis is one of the most powerful techniques for improving your trading accuracy. Use the higher timeframe (daily or weekly) to determine the trend direction as your primary bias. Use the medium timeframe (4-hour or 1-hour) to identify specific setups within that trend. Use the lower timeframe (15-minute or 5-minute) to fine-tune your entry with precise candlestick confirmation. Never trade against the higher timeframe trend, and never enter a trade when your timeframes are in conflict. A three-timeframe aligned setup — trend, pullback, and reversal pattern — provides some of the highest-probability entry signals available in technical analysis. Make multiple timeframe analysis a non-negotiable part of your trading routine, and you will immediately see an improvement in your trade selection and overall profitability.
A passionate writer and content creator.
Community Comments
Please log in to comment on this blog post.
Log InNo comments yet. Be the first to comment!