
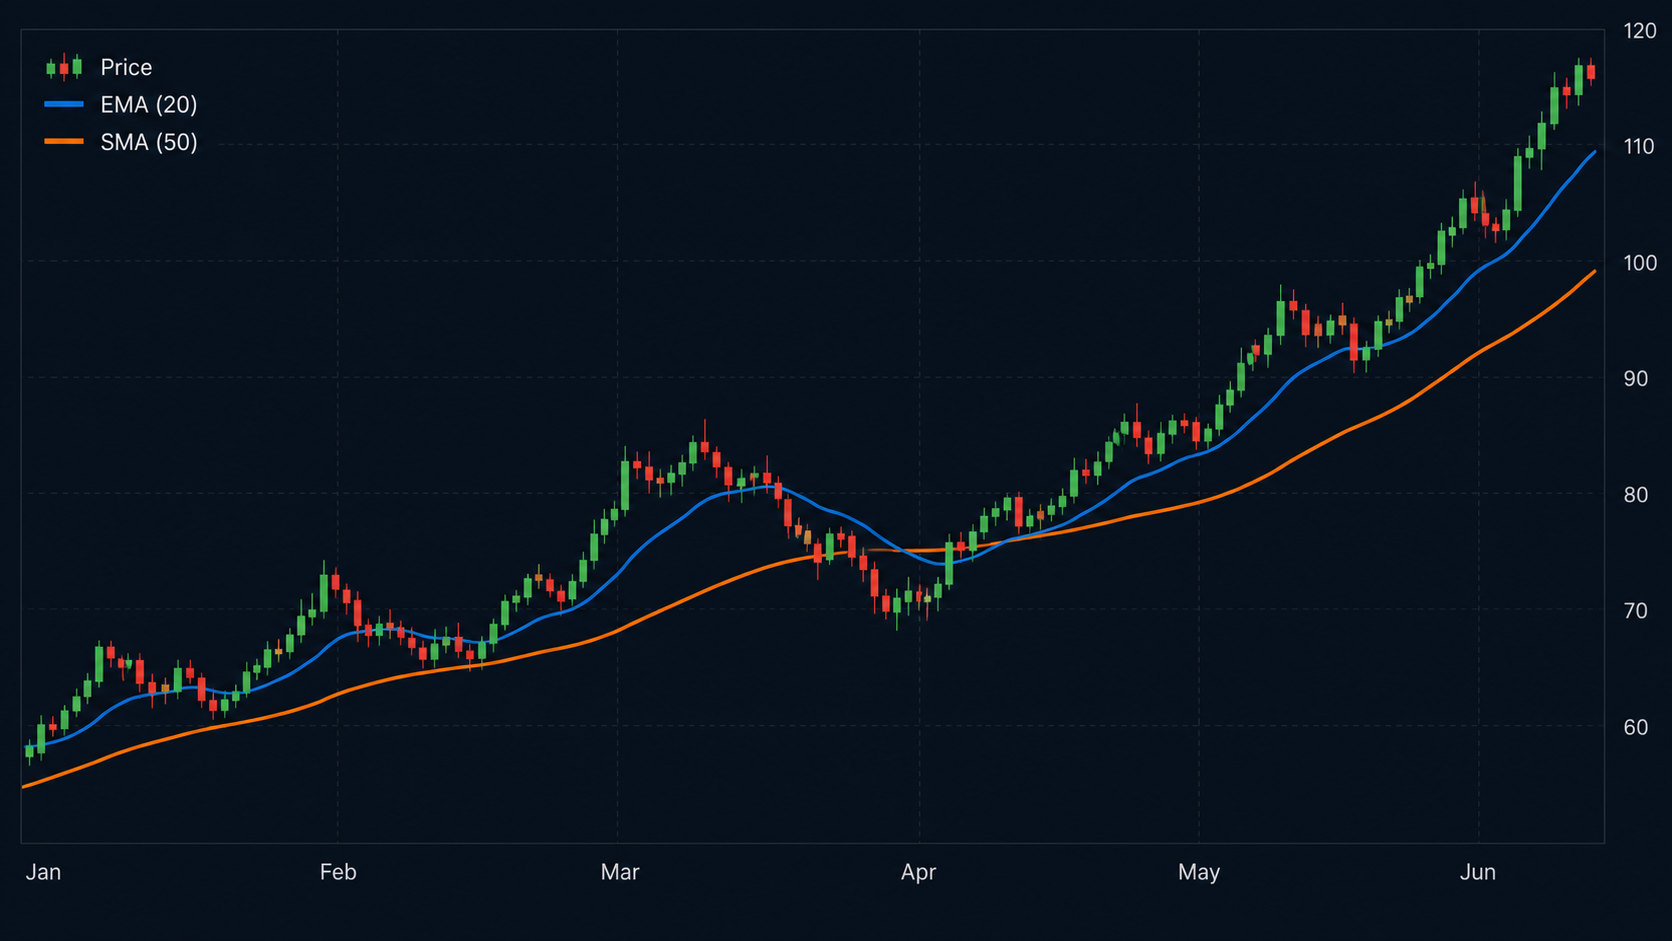
Moving Averages Explained: SMA, EMA, and How to Use Them

What Are Moving Averages?
Moving averages (MAs) are among the most popular and versatile technical indicators in forex trading. They smooth price data over a specified period, helping traders identify trend direction, dynamic support and resistance levels, and potential entry and exit points. By filtering out the noise of random price fluctuations, moving averages reveal the underlying trend with remarkable clarity. Despite their mathematical simplicity, they form the foundation of many profitable trading strategies and are used by traders of all experience levels — from beginners to institutional fund managers.
The core principle behind moving averages is that they represent the average price over a specific number of periods, updated continuously as new price data becomes available. A 20-period moving average shows the average price over the last 20 candles, and each new candle causes the average to \"move\" by dropping the oldest price and including the newest one. This smoothing effect makes it easier to see the market's direction at a glance. Moving averages can be applied to any timeframe and any instrument, making them one of the most universally applicable tools in your trading toolkit.
SMA vs EMA
- Simple Moving Average (SMA) — gives equal weight to all periods in the calculation. A 50-period SMA adds the closing prices of the last 50 candles and divides by 50. This equal weighting makes the SMA slower to react to recent price changes but provides smoother, more reliable signals. SMAs are best for identifying the overall trend direction and acting as dynamic support and resistance on higher timeframes.
- Exponential Moving Average (EMA) — gives more weight to recent prices, making it react faster to new price information. The 20-period EMA places greater emphasis on the most recent candles, allowing it to turn more quickly when price changes direction. This responsiveness makes EMAs better for short-term trading and entry timing, but they also generate more false signals due to their sensitivity.
- Use SMA for longer-term trend identification — the 50 SMA and 200 SMA are excellent for determining the primary trend on daily and weekly charts. Use EMA for shorter-term signals — the 20 EMA and 9 EMA are popular choices for entry timing on lower timeframes. Many traders use a combination of both: SMA to define the trend and EMA to time their entries within that trend.
Popular Moving Average Periods
The 20 EMA is excellent for short-term trend trading — it hugs price closely and provides dynamic support in uptrends and resistance in downtrends. The 50 SMA defines the intermediate trend and is widely watched by institutional traders — a bounce or break at the 50 SMA often triggers significant market movement. The 200 SMA is the ultimate bull/bear line — when price is above it, the long-term trend is bullish; when below, it is bearish. The crossover of the 50 and 200 SMA produces the Golden Cross (bullish, 50 above 200) and Death Cross (bearish, 50 below 200), which are among the most followed signals in all of technical analysis. Other useful periods include the 9 EMA for ultra-short-term scalpers, the 100 SMA for multi-month trend analysis, and the 20 SMA as a compromise between the responsiveness of EMA and the smoothness of SMA.
Practical Trading Strategies
Buy when price pulls back to the 20 EMA in an uptrend — this is one of the simplest and most effective trend-following strategies. The pullback to the moving average provides a favorable risk-reward entry with a tight stop below the EMA or the recent swing low. Sell when price bounces down from the 20 EMA in a downtrend with the opposite logic. Use two MAs (fast and slow) and trade the crossover direction — buy when the fast MA crosses above the slow MA, sell when it crosses below. The most popular combination is the 9 EMA crossing the 21 EMA on the 1-hour chart for day trading, or the 50 SMA crossing the 200 SMA on the daily chart for long-term position trading.
Moving averages also function as dynamic support and resistance. In a strong uptrend, price rarely dips below the 20 EMA before bouncing higher. In a strong downtrend, price rarely climbs above the 20 EMA before falling further. You can use these levels to set profit targets — take partial profits when price reaches the 50 SMA during a pullback, or when it extends significantly above the 20 EMA in a strong trend. The key to successful moving average trading is to avoid using them in isolation — combine MA signals with market structure analysis, candlestick confirmation, and proper risk management for the best results.
Conclusion
Moving averages are essential tools that every trader should master. Understand the difference between SMA and EMA, learn which periods work best for your trading timeframe, and practice applying them in combination with other analysis techniques. The 20 EMA, 50 SMA, and 200 SMA form a powerful trio that can define your entire trading framework — identifying trend direction, timing entries on pullbacks, and setting stop loss and take profit levels. Like all indicators, moving averages are not perfect — they lag by nature and generate false signals in ranging markets. But when used correctly as part of a complete trading system, they provide clarity and structure that dramatically improve your trading decisions.
A passionate writer and content creator.
Community Comments
Please log in to comment on this blog post.
Log InNo comments yet. Be the first to comment!