
MACD Indicator: Complete Guide to Trend and Momentum Analysis

What Is MACD?
The Moving Average Convergence Divergence (MACD) is a versatile indicator that shows both trend direction and momentum strength in a single view. Developed by Gerald Appel in the 1970s, the MACD has become one of the most widely used technical indicators across all financial markets. What makes the MACD particularly valuable is its ability to combine trend-following and momentum-oscillator characteristics — it tells you both the direction of the trend and the strength behind it. This dual nature makes it useful for a wide range of trading styles, from swing trading to position trading.
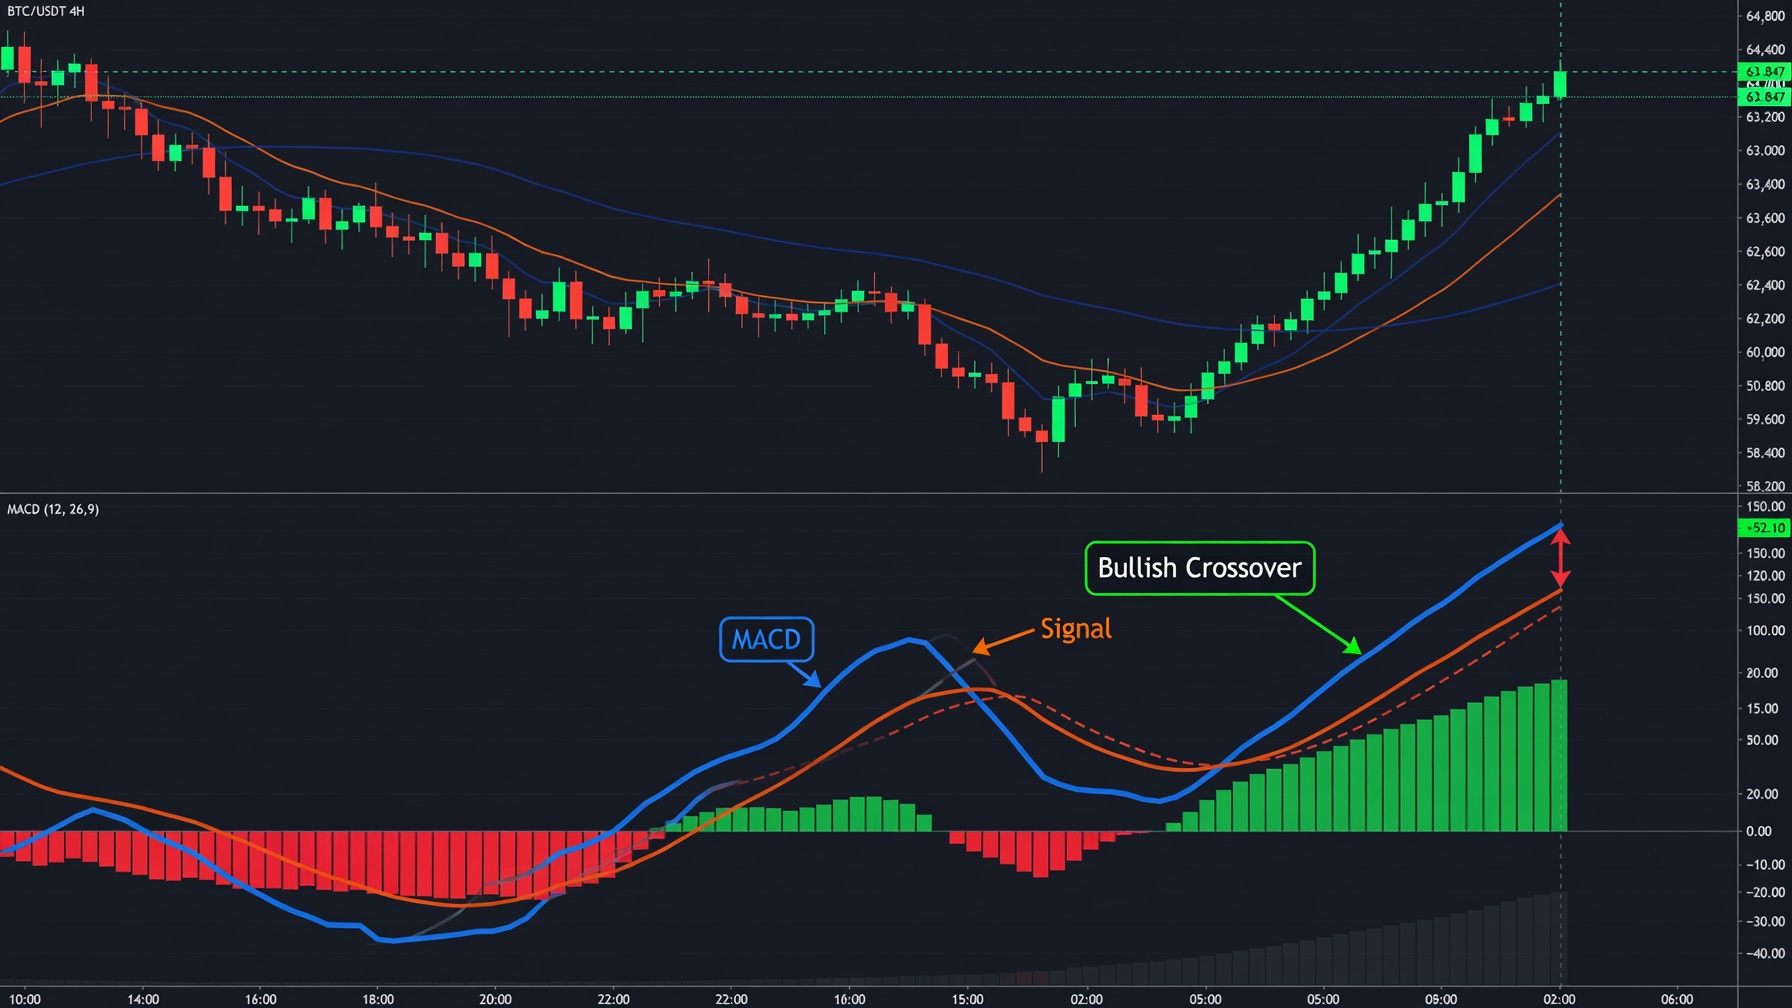
The MACD consists of three components that work together to generate trading signals. The MACD line (fast line) represents the difference between the 12-period EMA and the 26-period EMA — when the 12 EMA is above the 26 EMA, the MACD line is positive, indicating bullish momentum. The signal line (slow line) is a 9-period EMA of the MACD line, which smooths the MACD line and serves as a trigger for entry signals. The histogram represents the difference between the MACD line and the signal line — the bars show whether momentum is accelerating (bars growing) or decelerating (bars shrinking). Understanding how these three components interact is the key to mastering the MACD.
MACD Components
- MACD line — 12-period EMA minus 26-period EMA, showing the direction and strength of momentum. When the MACD line is above zero, the 12 EMA is above the 26 EMA (bullish). When below zero, the short-term trend is below the medium-term trend (bearish).
- Signal line — 9-period EMA of the MACD line. Crossovers between the MACD line and signal line generate the primary trading signals. A bullish crossover occurs when the MACD line crosses above the signal line. A bearish crossover occurs when it crosses below.
- Histogram — the visual representation of the difference between the MACD line and signal line. Rising histogram bars indicate accelerating momentum in the direction of the current trend. Falling bars indicate decelerating momentum, warning that the trend may be losing strength. Zero-line crossovers on the histogram occur when the MACD line crosses the signal line.
Trading Signals
When the MACD line crosses above the signal line, it generates a bullish signal suggesting it is a good time to buy. This crossover indicates that short-term momentum is accelerating faster than the smoothed average of momentum. A cross below the signal line is bearish and suggests selling. These crossovers are most reliable when they occur near the zero line — a crossover just above or below zero represents a momentum shift from a neutral position and tends to produce stronger moves. Crossovers far above or below zero, while still valid, may occur late in the trend and be less profitable.
The histogram provides additional confirmation. When histogram bars are rising (each bar is taller than the previous one), momentum is strengthening in the direction of the trend. When bars are shrinking (each bar is shorter than the previous one), momentum is weakening, suggesting the trend may be nearing exhaustion. A common strategy is to wait for both a MACD line crossover AND a histogram reversal (bars starting to rise after falling, or vice versa) before entering a trade. This dual confirmation filters out many false signals and improves the reliability of your entries.
MACD Divergence
If price makes higher highs but MACD makes lower highs, bearish divergence warns of a potential reversal. The market is rising, but the momentum behind the rise is decreasing — this inconsistency often precedes a trend reversal. Bullish divergence occurs when price makes lower lows but MACD makes higher lows, indicating that selling pressure is waning. Divergence between price and MACD is one of the most powerful signals in technical analysis. As with RSI divergence, wait for confirmation before trading — look for a MACD line crossover or a price break of the recent trendline to confirm that the anticipated reversal is underway. Divergence works best on higher timeframes (daily, 4-hour) and when it forms after an extended trend.
Practical MACD Strategy
A complete MACD-based strategy combines multiple signals. Start by determining the overall trend — is the MACD line above or below zero? Trade only in the direction of the zero-line bias. Next, look for signal line crossovers in the direction of the trend — buy when the MACD line crosses above the signal line while both are above zero (bullish alignment). Use the histogram to confirm momentum acceleration — enter only when the histogram is rising. Finally, set your stop loss below the recent swing low (for longs) and target the next major resistance level. This multi-signal approach dramatically improves the reliability of MACD-based trading and helps you avoid the false signals that plague traders who rely on crossovers alone.
Conclusion
The MACD indicator is a powerful tool that combines trend and momentum analysis into one clear visual display. Master the three components — MACD line, signal line, and histogram — and learn to read the signals they generate: crossovers for entry timing, histogram direction for momentum confirmation, and divergence for early reversal warnings. Use the zero line as a trend filter, combine multiple signals before entering, and always confirm with price action and market structure. The MACD is not a standalone system, but when integrated into a complete trading approach, it provides invaluable insights that can significantly improve your trading results.
A passionate writer and content creator.
Community Comments
Please log in to comment on this blog post.
Log InNo comments yet. Be the first to comment!